

Make Local ROI Easier to Prove
ROI Reporting unifies spend, conversions, customers, and revenue across connected channels and locations, so brand-to-local teams can turn scattered performance data into proof of what moved the business.
End Spreadsheet Attribution
No more stitching together dashboards, exports, and that one spreadsheet that has seen too much. ROI Reporting brings campaign data, connected channel performance, and revenue data into one clear view.
The numbers already exist. Ignition AI helps them make sense.
Spend-to-Revenue Visibility
When CRM, POS, and revenue data are connected, ROI Reporting shows how spend translates into conversions, customers, and revenue. Not just clicks. Not just form fills. The numbers finance was going to ask for anyway, and the proof your next decision needs.
Compare Channel and Location Performance
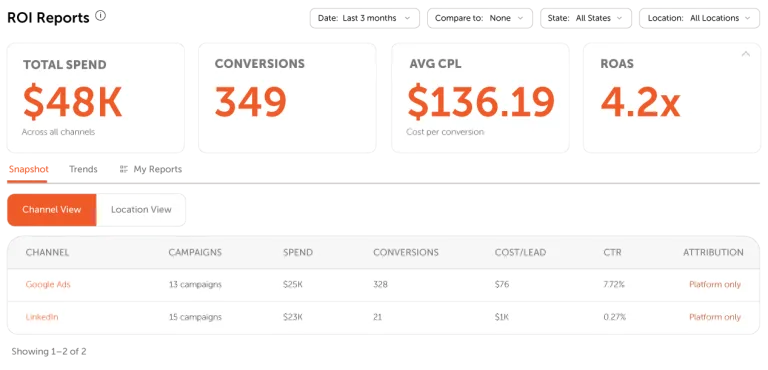
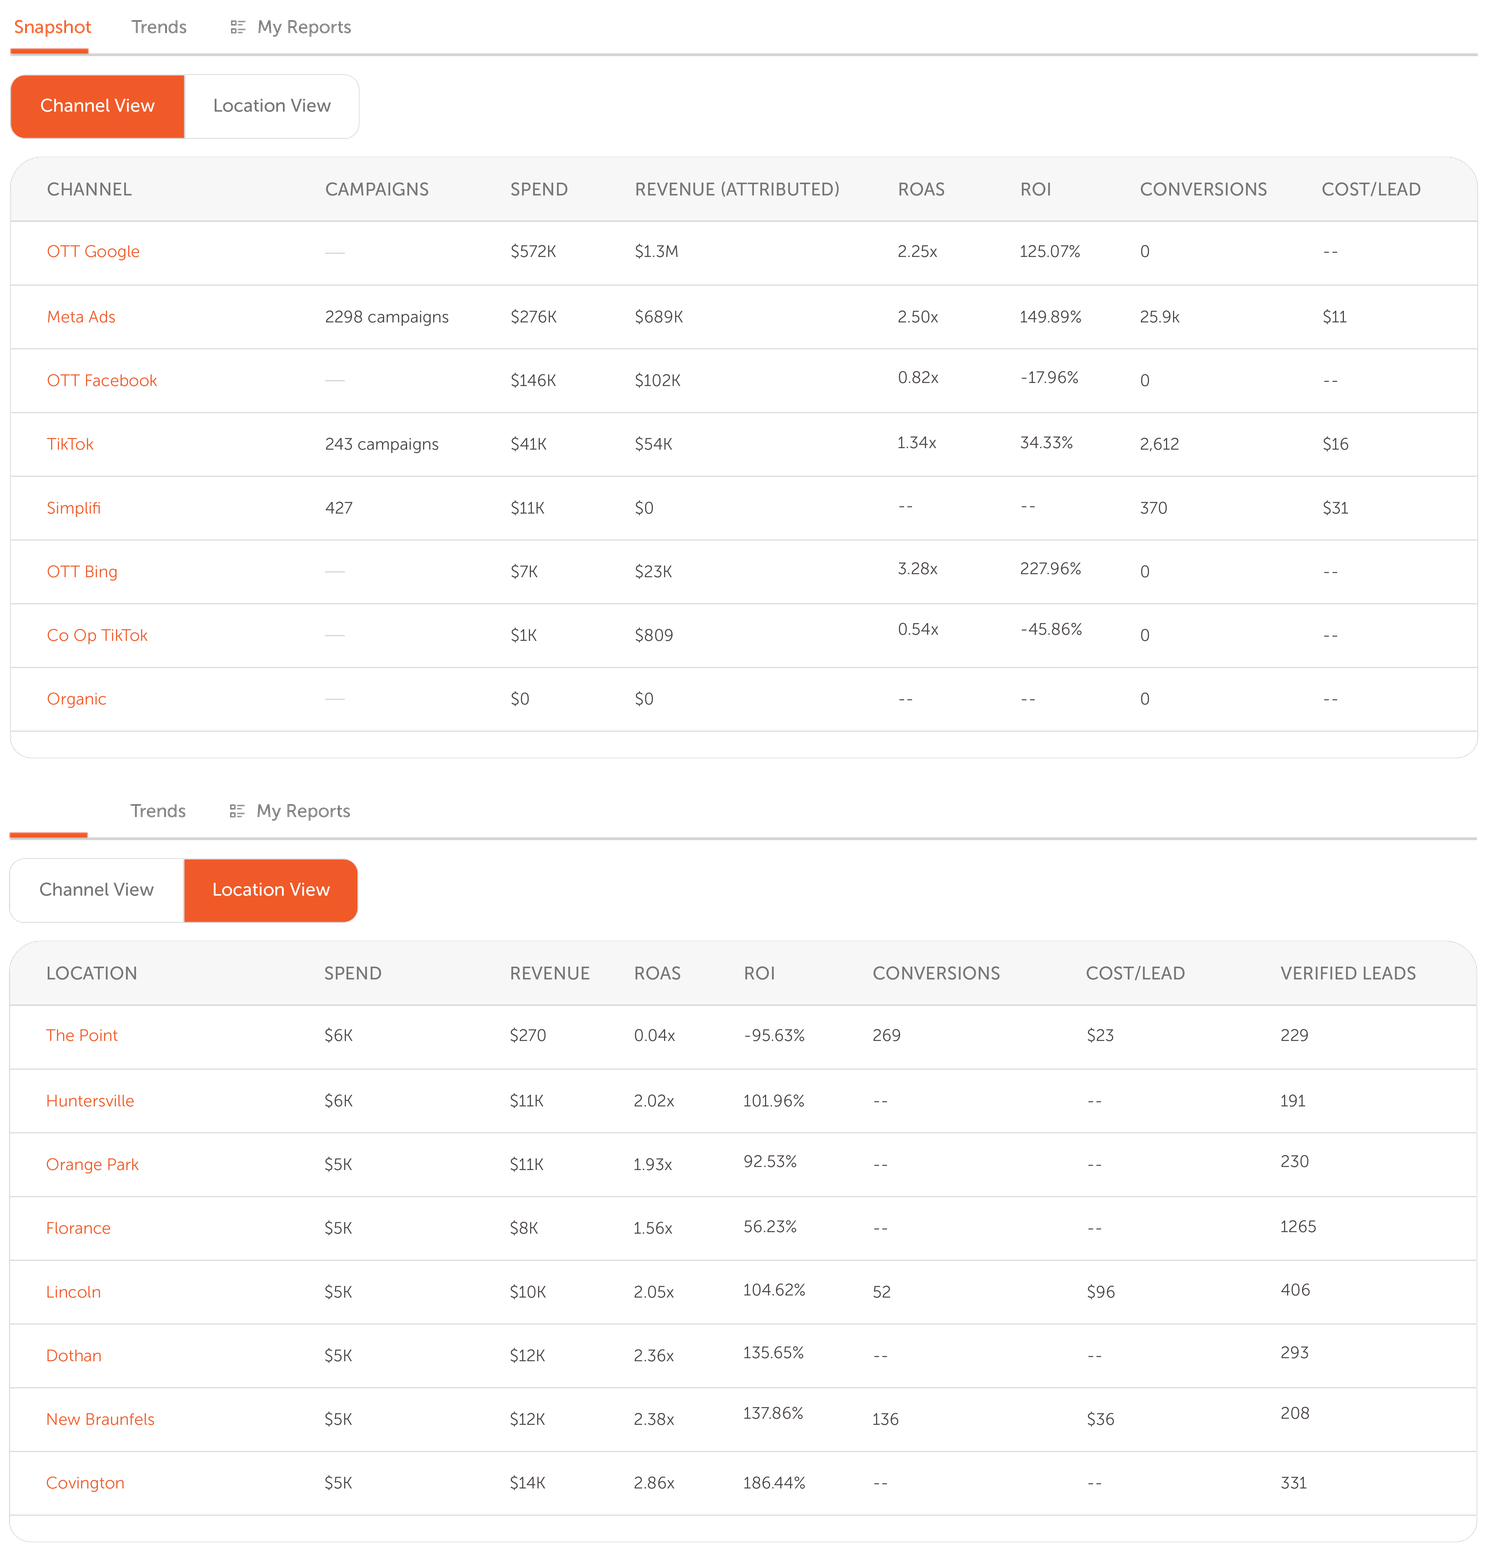
Switch between Channel View and Location View without changing the math halfway through. Paid social, search, direct mail, programmatic, and other connected campaigns can be evaluated through the same lens, while location-level filters help teams compare performance by market, state, campaign, channel, or date range. See which channels earned budget, which locations are pulling weight, and where the story gets interesting.
Snapshot, Trends, and Saved Reports
Move from quick performance snapshots to time-series trends, then save the views your team comes back to every month. Preferred filters, ready when you need them. Because rebuilding the same report repeatedly is not a personality trait. Download branded PDF or CSV reports for the same numbers with less scrambling.
Ask Iggy About This Report
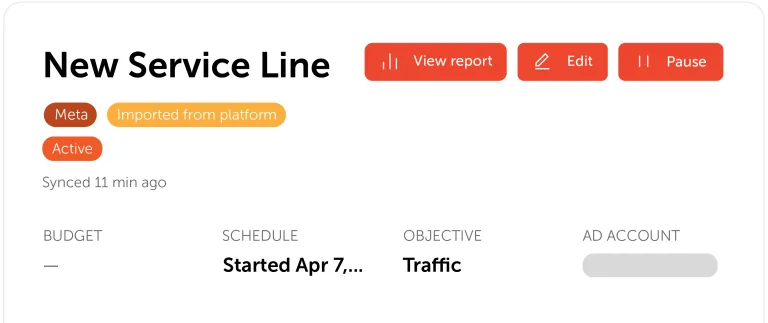
Every ROI report connects to Iggy, Ignition AI’s intelligent chatbot, so users can ask questions about the report they are reviewing in plain language. Iggy carries the report context forward, helping teams surface what changed, where performance is slipping, which locations need attention, and what to do next without leaving the page.
For Corporate Teams that Need Local Proof
ROI Reporting helps teams see performance clearly across the networks, regions, branches, dealers, advisors, franchisees, and locations responsible for making marketing work.

Automotive
Always-On Service Demand


Manufacturing
Co-Op Dollars Better Used


Quick Service Restaurants
Traffic, Frequency, & Loyalty


Healthcare
Patient Acquisition Handled Carefully


Financial Services
Compliant Advisor-Led Growth


Health & Wellness
Membership Growth & Repeat Visits

Proof is Easier from One View
Active Brands
Using the platform to manage local marketing execution
Locations Supported
Across local teams, operators, dealers, advisors, and partners
Platform Users
Across brands and locations
Orders Processed Annually
Helping teams move local marketing from request to execution
More to Prove Marketing Worked

What Multi-Location Marketers Get Wrong About Attribution
Attribution sounds easy—simply track what’s working and do more of it. But in reality? Most multi-location marketers are flying blind with oversimplified, misleading, or just incomplete and incorrect marketing attribution models.

The Holes in Your Marketing Data
It’s a marketing maxim: Before marketers can attribute results, they need trustworthy data. And let’s be honest—most multi-location brands are trying to build performance reports without all the information. Their data is full of holes.
Your Reporting Shouldn’t Need a Translator
Ignition AI ROI Reporting connects physical and digital campaign performance to revenue-level proof across the places, platforms, and locations where brand-to-local marketing happens.